Introduction
If you manage Oracle Exadata long enough, a disk will fail. Or a flash card will start throwing warnings at 2 a.m. When you open a service request with Oracle Support, the first thing they usually ask for is a sundiag report.
Many DBAs run the script, upload the file and never look inside it. That's a missed chance. Once you know what sundiag collects, you can often spot the problem yourself before Support even replies.
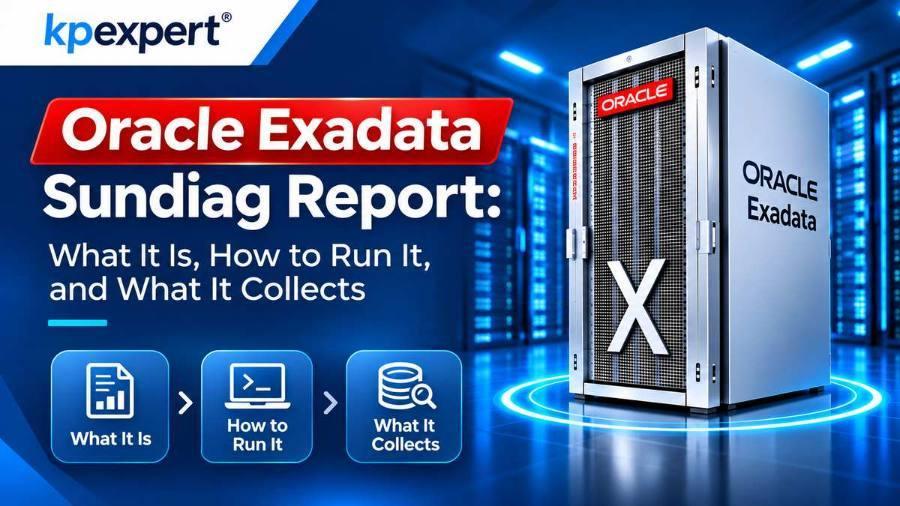
In this post, we'll cover what sundiag is, when to run it, how to run it, and exactly what information ends up in the report.
What Is Sundiag in Oracle Exadata?
Sundiag is a shell script, sundiag.sh, that ships with every Exadata system. You'll find it here on both database servers and storage cells:
/opt/oracle.SupportTools/sundiag.sh
The name comes from the Sun hardware days, but the script is still used on current Exadata models. Its job is simple: gather hardware and OS diagnostic data in one go and pack it into a single compressed file.
Think of it as a snapshot of the server's physical health. Disks, RAID controller, flash, logs and hardware events, all in one place. Oracle Support uses it to confirm a hardware fault and decide whether to send a replacement part or an engineer.
When Should You Run Sundiag?
You don't need it every day. Run it when something on the hardware side looks wrong, for example:
- A physical disk shows
failed,predictive failureorpoor performancestatus - A flash card or flash disk reports errors
- CellCLI alert history shows new hardware alerts
- The RAID controller, battery or a fan is reporting a fault
- A server rebooted unexpectedly and you suspect hardware
- Oracle Support asks for it on an SR
One habit worth building: collect sundiag before you open the SR. It saves a full round of back-and-forth with Support, and in a disk failure that can mean hours.
How to Run Sundiag on Exadata
Log in as root on the server with the problem. That could be a storage cell or a database server. Then run:
/opt/oracle.SupportTools/sundiag.sh
It takes a few minutes. When it finishes, it prints the path of the output file. Note it down.
Common options
The script accepts a few optional arguments. The exact set can vary by Exadata software version, so run sundiag.sh -h on your system to confirm.
| Option | What it adds |
|---|---|
osw | Copies ExaWatcher (OSWatcher on older releases) data into the bundle |
ilom | Collects ILOM data from the host through the internal IPMI interface |
snapshot | Collects a full ILOM snapshot over the network; asks for the ILOM root password |
Example with ExaWatcher and ILOM data:
/opt/oracle.SupportTools/sundiag.sh osw ilom
Running it on all storage cells at once
If the issue spans several cells, or Support wants data from all of them, use dcli from a database server:
dcli -g cell_group -l root /opt/oracle.SupportTools/sundiag.sh
Here cell_group is a text file listing your cell hostnames. Keep in mind that each cell writes its own output file locally. You'll need to copy them back to one place before uploading.
What Information Does a Sundiag Report Collect?
This is the part most people skip. Open the bundle and you'll find data grouped roughly like this.
| Area | What's collected | Why it matters |
|---|---|---|
| Disks and RAID controller | MegaCLI or StorCLI output (depending on model): adapter info, physical disk list, virtual drives, controller event log, battery or capacitor status | Shows which disk failed, its slot, error counts and controller health |
| Flash | Flash card and flash module status, firmware, error counters | Flags failing flash cards that affect Smart Flash Cache |
| CellCLI data (storage cells) | Output of commands such as list physicaldisk detail, list celldisk, list griddisk, list alerthistory | Links a hardware fault to the Exadata disks ASM actually uses |
| OS logs | /var/log/messages, dmesg output | Reveals I/O errors, SCSI resets and kernel warnings around the failure time |
| Hardware inventory | PCI devices (lspci), disk partitions, CPU and memory details | Confirms what hardware is installed and seen by the OS |
| Versions | Exadata image version (imageinfo, imagehistory), firmware levels | Support checks for known bugs and firmware issues |
| ILOM and IPMI | System event log (SEL), sensor readings, ILOM snapshot (with ilom or snapshot option) | Captures fan, power supply, temperature and motherboard faults |
| ExaWatcher | Performance history files (with osw option) | Shows system load and I/O behaviour before and during the problem |
You don't have to read all of it. For most disk issues, the CellCLI output, the RAID controller logs and /var/log/messages tell most of the story.
Where Is the Sundiag Output Stored?
The script creates one compressed archive. The file name follows this pattern:
sundiag_<hostname>_<serial_number>_<timestamp>.tar.bz2
On many releases it lands in /tmp. Newer Exadata versions may use a different directory, such as /var/log/exadatatmp. Don't guess. The last lines the script prints show the exact path.
/tmp. A full filesystem can make the collection fail halfway, and you end up with an incomplete bundle.How to Read Sundiag for a Failed Disk
Say a cell has raised a disk alert. Extract the bundle first:
tar -xjf sundiag_<hostname>_<serial>_<timestamp>.tar.bz2
Then work through it in this order:
- Start with CellCLI output. Look at the physical disk details. Find the disk whose status isn't
normal, and note its slot number and serial. - Check alert history. It tells you when the problem started and whether it was a sudden failure or a slow decline.
- Open the RAID controller logs. Search for the same slot. Media errors and predictive failure counts that keep climbing are a clear sign the disk is going.
- Scan
/var/log/messagesaround that time. I/O errors or SCSI resets on the matching device confirm the picture. - Glance at the ILOM event log. If there are power, fan or temperature events at the same time, the disk may not be the root cause.
If all of these point to one disk, you already know what Support will say. Your SR can be specific: slot, serial, status and the time of first error.
Best Practices for Uploading Sundiag to Oracle Support
A few small things make a real difference to how fast your SR moves:
- Collect from the right server. Run sundiag on the cell or DB server that has the fault, not the one you happen to be logged into.
- Run it soon after the failure. Logs rotate. Wait too long and the useful evidence is gone.
- Add ILOM data for non-disk issues. For fans, power supplies or motherboard faults, include the
ilomorsnapshotoption. - Upload the file as is. Don't extract and re-zip it. Support's tools expect the original archive.
- Write a clear summary in the SR. Mention the hostname, the alert text and the time it started. It saves the engineer from digging.
- Keep a copy. If the SR is escalated or reopened, you won't need to collect it again.
Sundiag vs ExaWatcher vs exachk vs sosreport
These tools overlap a little, which confuses people. Here's the quick way to tell them apart.
| Tool | Main purpose | Use it when |
|---|---|---|
| sundiag | Hardware diagnostic snapshot | A disk, flash card or other component looks faulty |
| ExaWatcher | Continuous OS and performance data collection | You need to see what the system was doing over time |
| exachk | Health check against Oracle best practices | Routine audits, before and after patching |
| sosreport | Generic Linux OS diagnostic bundle | Support asks for deep OS-level detail |
In short, sundiag answers “is the hardware broken?” The others answer different questions.
Frequently Asked Questions
Does running sundiag affect the running database?
No, not in any noticeable way. It only reads logs and hardware status, so it's safe to run on a live system. It does use some CPU and disk space for a few minutes, so avoid running it on every cell at peak hours unless you have to.
Do I need to run sundiag on database servers or only on storage cells?
Run it wherever the problem is. Disk and flash failures usually mean a storage cell. But database servers have local disks, a RAID controller and ILOM too, so sundiag works there just the same.
How long does sundiag take to complete?
Usually a few minutes. Adding the osw or snapshot option makes it slower, because it copies more data and talks to the ILOM.
Can I run sundiag as a non-root user?
No. It needs root access to read the RAID controller, hardware logs and ILOM data. Running it as another user will give you an incomplete or failed collection.
How do I know which sundiag file to upload if I ran it several times?
Check the timestamp in the file name. Upload the one collected closest to the time of the failure. If Support asked for data from several cells, upload one file per cell and mention the hostnames in your SR update.
Conclusion
Sundiag is one of those tools that looks boring until the day you need it. It's a single command, it takes a few minutes, and it gives Oracle Support almost everything they need to act on a hardware fault.
The bigger win comes when you learn to read it yourself. You stop waiting on Support for answers you could find in ten minutes, and your SRs get resolved faster.