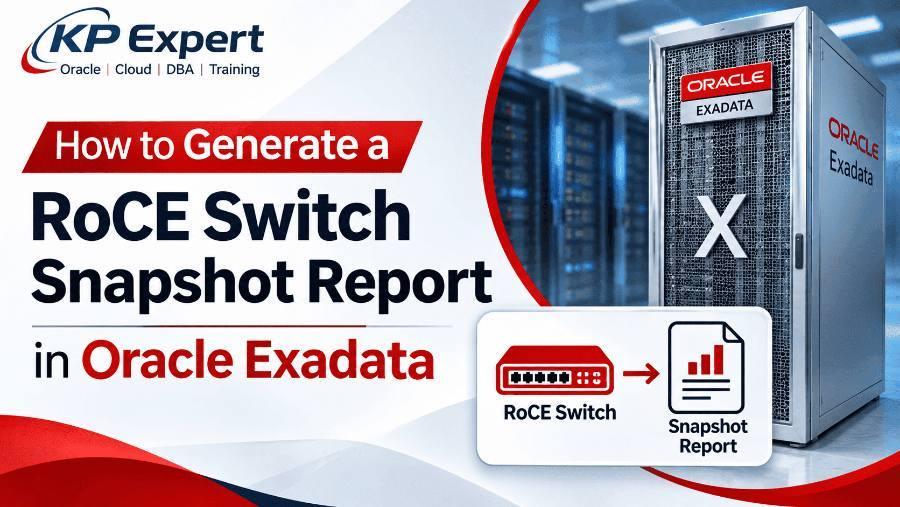
Take a snapshot of every RoCE switch before maintenance, another after, and compare them. This guide shows the exact NX-OS commands, what the report collects and how to read the differences.
Updated 10 November 2026 by KP Expert
In this guide
- Introduction
- RoCE network fabric architecture
- What is an NX-OS snapshot and how does it work?
- When to take a snapshot report
- Prerequisites and preparation checklist
- Step-by-step: generating the RoCE switch snapshot report
- What information the RoCE switch snapshot report collects
- Reading the comparison report
- Complementary data to collect
- Automating the snapshot report
- Troubleshooting common issues
- Best practices
- Command cheat sheet
- Frequently asked questions
- Conclusion
Introduction
A RoCE switch snapshot report is a point-in-time record of a switch's operational state, taken before and after a change so the two can be compared line by line. On Oracle Exadata X8M and later, it is the fastest way to prove that every database server and storage cell link came back after patching, cabling work or a switch replacement.
Starting with Exadata X8M, Oracle replaced the InfiniBand internal network with RoCE (RDMA over Converged Ethernet). RoCE runs the RDMA protocol on top of Ethernet, so Exadata features such as Smart Scan, Exadata RDMA Memory and cluster interconnect traffic keep working. The switches that carry this traffic are Cisco Nexus switches running NX-OS, managed with Oracle-supplied golden configuration files.
Because every server is connected to two switches, a single failed link does not cause an outage. That redundancy is also the risk: a port that stays down after maintenance can go unnoticed for weeks, until the second path fails. A snapshot comparison catches it within minutes.
RoCE network fabric architecture
Every Exadata rack has at least two RoCE leaf switches, and every database server and storage cell has one link to each. In multi-rack configurations, spine switches connect the leaf switches of different racks.
| Component | Typical hostname | Role | What the snapshot should show |
|---|---|---|---|
| Lower leaf (Cisco Nexus 9336C-FX2) | <rack>sw-rocea0 | First RoCE path for every server | All host ports up at 100 Gbps |
| Upper leaf (Cisco Nexus 9336C-FX2) | <rack>sw-roceb0 | Second RoCE path for every server | All host ports up at 100 Gbps |
| Spine switch (multi-rack only) | <rack>sw-roces0 | Connects leaf switches across racks | Inter-switch links up, neighbors established |
| Database server | <rack>dbadm01 | Two RoCE ports, re0 and re1 | Seen as an LLDP neighbor on each leaf |
| Storage cell | <rack>celadm01 | Two RoCE ports, one to each leaf | Seen as an LLDP neighbor on each leaf |
| Management switch (Cisco 9348GC-FXP) | <rack>sw-adm0 | Admin network, not RoCE | Not part of the RoCE snapshot |
Golden configuration
Oracle ships a fixed configuration for each switch role, applied with run-script during deployment or replacement. Files include roce_leaf_switch.cfg (single-rack leaf), roce_spine_switch_multi.cfg (multi-rack spine), roce_leaf_switch_multi.cfg (multi-rack leaf) and Secure Fabric variants (Oracle docs). Never edit this configuration by hand. Snapshots only read state, so they are safe on golden-configured switches.
Lossless Ethernet (QoS)
RDMA needs a network that does not drop packets. The golden configuration enables Priority Flow Control (PFC) and Explicit Congestion Notification (ECN) with DSCP-based traffic classes. A port can be up but still hurt performance if its QoS is wrong or its pause counters climb, so your snapshot should include QoS and error sections, not just link status.
Why two switches matter
If rocea0 loses a server port, traffic silently moves to roceb0. The database keeps running and the rack now has a single point of failure. A before-and-after comparison makes that hidden loss of redundancy visible immediately.
What is an NX-OS snapshot and how does it work?
An NX-OS snapshot runs a set of show commands, stores their structured output on the switch under a name, and lets you compare any two snapshots field by field. It can capture the running states of selected features, add new show commands, and delete or compare snapshots (Ansible nxos_snapshot docs).
Sections
A snapshot is made of sections. Each section is one show command plus the details NX-OS needs to match rows between two snapshots.
| Part of a section | Meaning | Example |
|---|---|---|
| Section name | Label used in reports | v4route |
| Show command | Command whose output is captured | show ip route detail vrf all |
| Row id | XML/JSON tag that marks one row of output | ROW_prefix |
| Key 1 | Field that uniquely identifies a row | ipprefix |
| Key 2 (optional) | Second field when one key is not unique | - |
The example is Cisco's own sample section (Cisco NX-API reference). Because NX-OS matches rows by key, the comparison tells you exactly which interface, prefix or neighbor changed, rather than giving you a raw text diff.
Default and user-defined content
Every snapshot includes a built-in set of feature states, typically interfaces and any enabled protocols such as BGP, OSPF, STP or vPC. Sections you add with snapshot section add are captured on top. The default list varies by NX-OS release, so check it with show snapshots dump <name> after your first snapshot.
Storage and lifetime
Snapshots are stored on the switch and survive a reload. They take very little space but are never deleted automatically, so remove old ones yourself.
Relationship to maintenance mode
Cisco's Graceful Insertion and Removal (GIR) feature creates before_maintenance and after_maintenance snapshots automatically. On Exadata, do not use GIR unless an Oracle procedure tells you to. Create snapshots manually as shown below.
snapshot section add changes anything, and it edits the snapshot definition, not the golden network configuration.When to take a snapshot report
Take a snapshot before and after any activity that can touch the RoCE fabric, and keep a monthly baseline when nothing is changing.
| Activity | Before | After | What you are proving |
|---|---|---|---|
| RoCE switch firmware upgrade with patchmgr | Yes | Yes | Every port and neighbor returned after reload |
| Exadata software update on servers (rolling) | Yes | Yes | Each server's two links came back after reboot |
| Cable, transceiver or HCA replacement | Yes | Yes | Repaired port is up, other ports undisturbed |
| RoCE switch replacement | From the old switch, if reachable | Yes | New switch matches the old switch's state |
| Adding a server, cell or rack | Yes | Yes | New ports up, existing ports unchanged |
| Applying or refreshing golden configuration | Yes | Yes | No links or QoS lost |
| Data center power work or rack move | Yes | Yes | Full fabric restored |
| Performance or connectivity complaint | Last baseline | Now | What changed since the system was healthy |
| Routine health check | Monthly baseline | - | Reference point for future comparisons |
Prerequisites and preparation checklist
You need SSH access to each RoCE switch as admin, and about 10 minutes per switch for the before and after captures.
- List every RoCE switch hostname and management IP (both leaves per rack, plus spines). The
roceswitches.lstfile used by patchmgr is a good source. - Confirm the
adminpassword works on each switch. - Confirm SSH reachability from a database server:
ssh admin@exa01sw-rocea0. - Confirm all servers and cells are up, so the baseline reflects a healthy fabric.
- Pick a naming convention, for example
pre_<activity>_<ddmonyyyy>andpost_<activity>_<ddmonyyyy>. - Create a working directory for saved output, for example
/root/roce_snapshots/<date>. - Back up each switch configuration before the change.
- If an Oracle Service Request is open, note the SR number for the snapshot description.
Run switch commands while connected to the switch management interface as the switch administrator, as the Exadata documentation requires (Oracle docs).
Step-by-step: generating the RoCE switch snapshot report
Log in, define sections once, take a before snapshot, do the work, take an after snapshot, compare, then save and clean up. Repeat on every RoCE switch. Sample outputs are illustrative; your values will differ.
1Log in to the switch
[root@exa01dbadm01 ~]# ssh admin@exa01sw-rocea0
User Access Verification
Password:
exa01sw-rocea0#
Confirm the switch identity and NX-OS version first:
exa01sw-rocea0# show hostname
exa01sw-rocea0# show version | include NXOS
  NXOS: version 10.x(x)
2List existing snapshots
exa01sw-rocea0# show snapshots
Snapshot Name         Time                         Description
-----------------------------------------------------------------
pre_patch_12may2026   Tue May 12 09:41:07 2026     Before patchmgr
If a snapshot with your planned name already exists, delete it (Step 9) or choose a new name.
3Review the current sections
exa01sw-rocea0# show snapshots sections
user-specified snapshot sections
--------------------------------
[v4route]
  show command: show ip route detail vrf all
  row id: ROW_prefix
  key1: ipprefix
  key2: -
An empty list means only the built-in content will be captured.
4Find the row id and key for a new section
Run the command with | json (or | xml) and look for the ROW_ tag and a field that is unique in each row:
exa01sw-rocea0# show interface brief | json
{"TABLE_interface": {"ROW_interface": [{"interface": "Ethernet1/1", "state": "up", ...}]}}
Here the row id is ROW_interface and key 1 is interface.
5Add Exadata-specific sections (once per switch)
exa01sw-rocea0# snapshot section add intbrief "show interface brief" ROW_interface interface
exa01sw-rocea0# snapshot section add lldpnbr "show lldp neighbors detail" ROW_nbor_detail l_port_id
exa01sw-rocea0# snapshot section add trans "show interface transceiver" ROW_interface interface
exa01sw-rocea0# snapshot section add errs "show interface counters errors" ROW_interface interface
ROW_ tag and key on your NX-OS release with Step 4, because tag names can change between versions. Add show interface priority-flow-control the same way after checking its JSON tags.6Create the "before" snapshot
exa01sw-rocea0# snapshot create pre_patch_10nov2026 Before RoCE firmware upgrade SR 3-XXXXXXXX
Executing 'show interface'... Done
Executing 'show lldp neighbors detail'... Done
...
Snapshot 'pre_patch_10nov2026' created
Check that it exists and see what was captured:
exa01sw-rocea0# show snapshots
exa01sw-rocea0# show snapshots dump pre_patch_10nov2026
Repeat Steps 1 to 6 on exa01sw-roceb0 and every spine before you start the maintenance.
7Perform the maintenance activity
Run the planned work, for example the switch firmware upgrade from the patchmgr directory:
[root@exa01dbadm01 patch]# ./patchmgr --roceswitches ~/roceswitches.lst --upgrade --roceswitch-precheck
[root@exa01dbadm01 patch]# ./patchmgr --roceswitches ~/roceswitches.lst --upgrade
Wait until the switch has fully booted and the server links have had a few minutes to come up.
8Create the "after" snapshot and compare
exa01sw-rocea0# snapshot create post_patch_10nov2026 After RoCE firmware upgrade SR 3-XXXXXXXX
exa01sw-rocea0# show snapshots compare pre_patch_10nov2026 post_patch_10nov2026 summary
Sample summary output:
feature              tag                  pre_patch_10nov2026   post_patch_10nov2026
-----------------------------------------------------------------------------------
basic summary
   # of interfaces                         38                    38
   # of vlans                              ..                    ..
   # of ipv4 routes                        ..                    ..

interfaces
   # of eth interfaces                     36                    36
   # of eth interfaces up                  30                    30
   # of eth interfaces down                 6                     6
Then view the full detail:
exa01sw-rocea0# show snapshots compare pre_patch_10nov2026 post_patch_10nov2026
In the detailed output, lines marked with ** show a value that differs between the two snapshots. No marked lines means the switch returned to exactly the same state.
9Save the report and clean up
Save the comparison from a database server so the output lands in your working directory:
[root@exa01dbadm01 ~]# mkdir -p /root/roce_snapshots/10nov2026 && cd /root/roce_snapshots/10nov2026
[root@exa01dbadm01 10nov2026]# ssh admin@exa01sw-rocea0 "show snapshots compare pre_patch_10nov2026 post_patch_10nov2026" > rocea0_compare.txt
[root@exa01dbadm01 10nov2026]# ssh admin@exa01sw-rocea0 "show snapshots dump post_patch_10nov2026" > rocea0_post_dump.txt
Once the report is saved and reviewed, remove old snapshots:
exa01sw-rocea0# snapshot delete pre_patch_10nov2026
exa01sw-rocea0# snapshot delete post_patch_10nov2026
Keep the latest healthy snapshot on the switch if your team compares against it later.
10Repeat on every switch
Run Steps 8 and 9 on exa01sw-roceb0 and each spine. The rack is only fully verified when every RoCE switch shows no unexpected differences.
What information the RoCE switch snapshot report collects
The report collects operational state in two layers: the built-in summary every snapshot has, and the detail from the Exadata sections you added. Together they answer one question: is every server and cell still connected, at full speed, on a clean and lossless path?
Layer 1: built-in summary
| Data point | What it tells you | Healthy value on a RoCE leaf |
|---|---|---|
| Number of interfaces | Total interfaces known to the switch | Same before and after |
| Ethernet interfaces up / down | How many physical ports are linked | Up count equals the number of cabled ports |
| VLANs | Number of VLANs defined | Unchanged (Secure Fabric adds more) |
| IPv4 / IPv6 routes | Size of the routing table | Unchanged |
| Protocol neighbors, where enabled | Sessions between switches in multi-rack fabrics | All sessions established |
| Spanning tree state, where enabled | Layer 2 loop protection state | Unchanged |
Layer 2: Exadata detail sections
| Section | What it collects | Why it matters |
|---|---|---|
Interface status (show interface brief) | Admin and operational state, speed, mode and down reason per port | Every cabled port should be up at 100G; reasons like Link not connected or XCVR not inserted explain failures |
LLDP neighbors (show lldp neighbors detail) | Connected system name, its port (re0 / re1) and management address | Maps each switch port to a named server or cell, so a missing host is identified instantly |
Transceivers (show interface transceiver) | Cable type, vendor, part number and serial number per port | A changed serial confirms a replacement; a missing entry means the module is not detected |
Error counters (show interface counters errors) | FCS, alignment, receive and transmit errors per port | A sharp jump on one port points to a bad cable, dirty connector or failing optic |
Lossless QoS (show interface priority-flow-control) | PFC mode and pause frames sent and received per port | PFC disabled or unusual pause counts signal a QoS or congestion problem |
| Routes and inter-switch links (multi-rack) | Route tables and neighbor sessions between leaves and spines | A lost session or prefix means part of the fabric is unreachable |
What the snapshot does not collect
- Logs and crash history: use
show loggingandshow tech-support. - The running configuration: back it up separately.
- The server side of the link: use
rocelinkinfo,ip linkand Exachk. - Hardware health (fans, power supplies, temperature): use
show environment.
Reading the comparison report
Start with the summary, then open the detail only for features whose counts changed. A clean report has identical counts and no marked lines.
- Run the
summarycompare and check interface up/down counts, VLANs, routes and neighbor counts. - If any count differs, run the full compare and search for marked (
**) lines. - For each marked line, note the feature, the key (interface, neighbor or prefix) and the before and after values.
- Map interface keys to hosts using the LLDP section from the before snapshot.
- Decide whether each difference is expected (planned) or unexpected (needs action).
| Difference seen | Likely meaning | Action |
|---|---|---|
| Port up before, down after | Server not rebooted yet, cable unseated or transceiver fault | Wait for host boot, reseat cable, check show interface ethX/Y |
| LLDP neighbor missing on an up port | LLDP not exchanged yet, or wrong host connected | Wait 1 to 2 minutes and recapture; check the cabling map |
| LLDP neighbor name changed | Cables swapped between ports | Compare with Oracle cabling tables and correct |
| Speed changed (100G to 40G) | Wrong or degraded cable or transceiver | Replace the cable; verify the transceiver part number |
| Transceiver serial changed | A component was replaced | Expected only if you replaced it |
| Error counters jumped on one port | Physical-layer problem | Clean or replace optics and cable; monitor again |
| PFC disabled or pause frames spiking | QoS misconfiguration or congestion | Check golden configuration; open an Oracle SR |
| Fewer routes or neighbor sessions | Inter-switch link or spine issue | Check uplink ports and spine snapshots |
| Counts identical, no marked lines | Switch returned to its original state | Record as verified |
Complementary data to collect
A snapshot shows whether state changed; it does not explain why. For a complete record or an Oracle Service Request, collect the following too.
Switch configuration backup
Back up every switch before any change, following the Exadata Maintenance Guide. A quick text copy can also be taken from a database server:
ssh admin@exa01sw-rocea0 "show running-config" > rocea0_running_config.txt
Switch diagnostic output
ssh admin@exa01sw-rocea0 "show tech-support details" > rocea0_tech_support.txt
ssh admin@exa01sw-rocea0 "show logging log" > rocea0_logging.txt
ssh admin@exa01sw-rocea0 "show environment" > rocea0_environment.txt
ssh admin@exa01sw-rocea0 "show version" > rocea0_version.txt
show tech-support details is large and can take several minutes. It is usually the first output Oracle Support asks for.
Exadata-side fabric checks
rocelinkinfoscans the RoCE fabric from the Exadata side and lists database servers, storage servers and leaf switches with their link descriptions (Oracle docs).- Follow "Verifying the RoCE Network Fabric Configuration" in the Maintenance Guide after hardware changes (Oracle docs).
- Check the RoCE interfaces on every server:
dcli -g ~/all_group -l root "ip link show re0; ip link show re1".
Rack-level health
- Run Exachk before and after maintenance and compare the reports.
- Capture image history:
dcli -g ~/all_group -l root "imagehistory" > imagehistory.txt(Oracle docs).
Patchmgr failures
If patchmgr fails on a RoCE or management switch, Oracle provides a My Oracle Support note listing the data to collect for the 9336 and 9348 switches (MOS 2871074.1). Send the patchmgr logs together with your snapshot comparison.
Automating the snapshot report
For racks with several switches, a short script run from a database server takes the same snapshot on every switch and saves all output in one place.
Shell script
Save as /root/roce_snap.sh. It reads switch names from roceswitches.lst (one per line) and takes a pre or post snapshot; on post it also saves the comparison.
#!/bin/bash
# Usage: ./roce_snap.sh pre|post <tag>   e.g. ./roce_snap.sh pre patch_10nov2026
PHASE=$1
TAG=$2
LIST=${LIST:-/root/roceswitches.lst}
OUT=/root/roce_snapshots/$TAG
mkdir -p "$OUT"

for SW in $(grep -v '^#' "$LIST"); do
  echo "=== $SW : ${PHASE}_${TAG} ==="
  ssh admin@"$SW" "snapshot create ${PHASE}_${TAG} ${PHASE} ${TAG}" > "$OUT/${SW}_${PHASE}_create.txt"
  ssh admin@"$SW" "show snapshots dump ${PHASE}_${TAG}" > "$OUT/${SW}_${PHASE}_dump.txt"
  if [ "$PHASE" = "post" ]; then
    ssh admin@"$SW" "show snapshots compare pre_${TAG} post_${TAG} summary" > "$OUT/${SW}_compare_summary.txt"
    ssh admin@"$SW" "show snapshots compare pre_${TAG} post_${TAG}" > "$OUT/${SW}_compare_full.txt"
    echo "Changed lines on $SW:"
    grep -c '\*\*' "$OUT/${SW}_compare_full.txt"
  fi
done
echo "Output saved in $OUT"ssh call prompts for the switch password unless key-based login already exists. Do not change switch configuration just to enable key login without checking with Oracle, because the switch runs golden configuration.Ansible
The cisco.nxos.nxos_snapshot module supports create, add, compare, delete and delete_all, and can save snapshots and comparison reports to local files (Ansible docs).
- cisco.nxos.nxos_snapshot:
    action: compare
    snapshot1: pre_patch_10nov2026
    snapshot2: post_patch_10nov2026
    comparison_results_file: rocea0_compare.txt
    compare_option: summary
    path: /root/roce_snapshots/
Troubleshooting common issues
| Problem | Cause | Fix |
|---|---|---|
snapshot create fails: name exists | Old snapshot with the same name | snapshot delete <name> or use a new name |
snapshot section add rejected | Wrong row id or key, or run from config mode | Check tags with show <command> | json; run from exec mode |
| Section empty in the dump | No matching ROW_ tag in the output | Pick the correct row tag; some commands return nested tables |
| Many differences in counters | Traffic counters always change | Focus on state, neighbor, speed and error sections |
| Ports down in the after snapshot | Servers still booting after switch reload | Wait a few minutes, then take a new after snapshot |
| SSH to switch refused | Switch still rebooting, or wrong IP | Ping the management IP; check roceswitches.lst |
show tech-support details very slow | Large output | Let it finish; redirect to a file |
| Snapshot missing after switch replacement | Snapshots stay on the old switch | Compare the new switch against saved before files |
| Differences on one leaf only | Problem on that switch or its cables | Compare with the other leaf; check LLDP and transceivers |
Best practices
- Snapshot every RoCE switch, both leaves and all spines, never just one.
- Take the before snapshot on all switches before touching any of them.
- Use dated names and put the SR number or change ID in the description.
- Add the Exadata sections once per switch and keep them.
- Wait for all hosts to finish booting before the after snapshot.
- Save every compare and dump off the switch; snapshots are lost if the switch is replaced.
- Keep one healthy baseline per switch and refresh it monthly.
- Never edit the golden configuration while working with snapshots.
Command cheat sheet
| Task | Command |
|---|---|
| List snapshots | show snapshots |
| List user sections | show snapshots sections |
| Find row id and key | show <command> | json |
| Add a section | snapshot section add <name> "<show command>" <row-id> <key1> [key2] |
| Remove a section | snapshot section delete <name> |
| Create a snapshot | snapshot create <name> <description> |
| View snapshot content | show snapshots dump <name> |
| Compare (summary) | show snapshots compare <name1> <name2> summary |
| Compare (full) | show snapshots compare <name1> <name2> |
| Delete one snapshot | snapshot delete <name> |
| Delete all snapshots | snapshot delete all |
| Save output from a server | ssh admin@<switch> "<command>" > file.txt |
Frequently asked questions
Does creating a snapshot affect database traffic?
No. It only runs show commands and stores the output. RDMA traffic and switch configuration are not touched.
Can I take a snapshot while the database is running?
Yes. Snapshots are designed to be taken on live switches.
Is a snapshot the same as a configuration backup?
No. A snapshot records operational state: what is up and what is connected. A backup records configuration: how the switch is set up. You need both.
Does Oracle Support accept snapshot comparisons?
They are useful supporting evidence, but Support usually also asks for show tech-support details, patchmgr logs and Exadata-side diagnostics.
Does this work on InfiniBand-based Exadata (X8 and earlier)?
No. InfiniBand switches use different tools. This procedure is for RoCE-based systems, X8M and later.
How long are snapshots kept?
Until you delete them. They survive a switch reload but not a switch replacement.
Conclusion
A RoCE switch snapshot report turns "the fabric looks fine" into proof. Take a snapshot on every switch before maintenance, take another after, and compare. Identical interface counts, the same LLDP neighbors on the same ports, stable error counters and active PFC mean the Exadata RoCE fabric is fully restored.
Add a configuration backup, show tech-support details and Exadata-side checks, and you have a complete record for your change log and for Oracle Support.