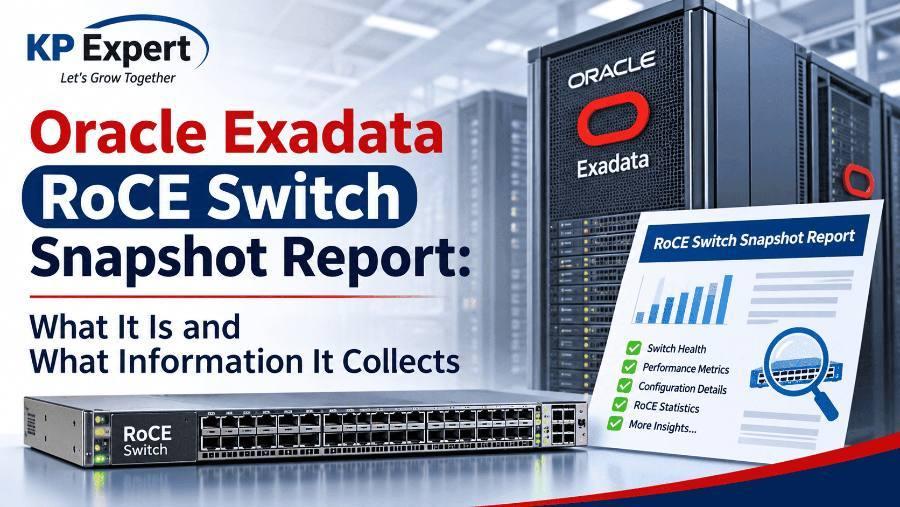
A deep look at the report DBAs use to prove the RoCE fabric came back after maintenance: where it comes from, how it is structured, and exactly what each layer records.
Updated 16 November 2026 by KP Expert · 9 min read
Key takeaways
- It is the Cisco NX-OS snapshot feature on Exadata's RoCE switches, not a separate Oracle tool.
- It collects in two layers: a built-in feature summary and Exadata detail sections you add.
- LLDP neighbors turn port numbers into named database servers and storage cells.
- Its real value is comparison: before vs after a change, matched row by row.
- It does not collect logs, configuration, hardware health or the server side of the link.
Contents
01Introduction
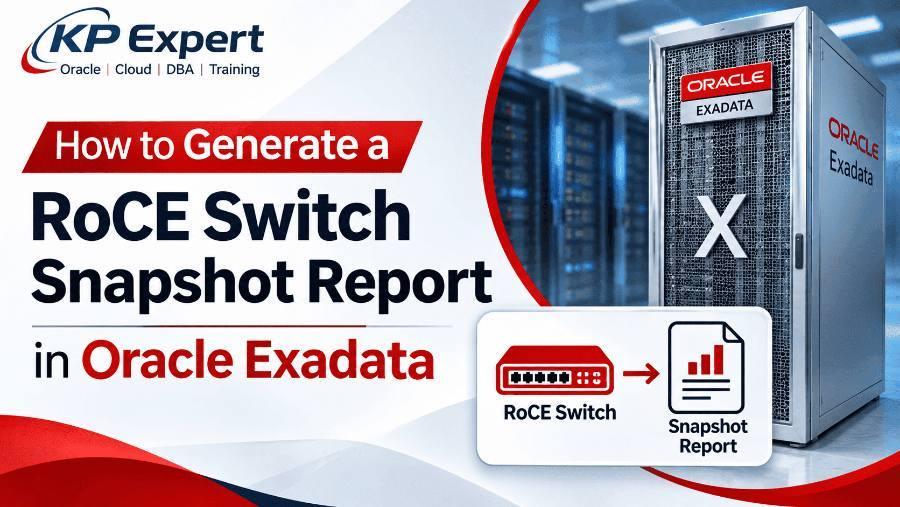
A RoCE switch snapshot report is a saved, point-in-time record of what an Exadata RoCE switch looks like while it is running: which ports are up, at what speed, which server or storage cell sits behind each port, and whether the links are clean and lossless. You take one before a change and one after, then compare them.
Since Exadata X8M, the internal network that carries Smart Scan, Exadata RDMA Memory (XRMEM) and RAC interconnect traffic runs on RDMA over Converged Ethernet (RoCE) instead of InfiniBand. RoCE runs the RDMA protocol on top of Ethernet, so existing Exadata performance features continue to work unchanged. The switches that carry this traffic are Cisco Nexus switches, and the snapshot report is built on their NX-OS snapshot feature.
This article explains the concept in depth: what the report really is, where it comes from, and exactly what it captures and what it does not. For hands-on commands, see our companion step-by-step guide to generating a RoCE switch snapshot report.
02Background: the Exadata RoCE Network Fabric
Every Exadata rack from X8M onward has at least two RoCE leaf switches, and every database server and storage server has one RoCE port cabled to each. The fabric connects the database and storage servers through a bonded interface to these switches. Multi-rack systems add spine switches to join the leaves of different racks.
| Component | Typical name | Role in the fabric |
|---|---|---|
| Lower leaf switch (Cisco Nexus 9336C-FX2) | <rack>sw-rocea0 | First RoCE path for every server and cell |
| Upper leaf switch (Cisco Nexus 9336C-FX2) | <rack>sw-roceb0 | Second RoCE path for every server and cell |
| Spine switch (multi-rack only) | <rack>sw-roces0 | Links leaf switches across racks |
| Database server / storage cell | <rack>dbadm01, <rack>celadm01 | Two RoCE ports (re0, re1), one per leaf |
Three properties of this fabric explain why a snapshot report is so useful:
- Redundancy hides failures. If one link drops, traffic moves to the other leaf and the database keeps running. A port that stays down after maintenance can go unnoticed until the second path fails.
- The configuration is fixed by Oracle. Switches run Oracle's golden configuration; Exadata 20.1.0 and later include a simplified procedure to apply it. You verify state rather than change settings.
- RDMA needs a lossless network. The golden configuration enables Priority Flow Control (PFC) and congestion signalling. A port can be up yet still hurt performance if its error or pause counters climb.
03What the RoCE switch snapshot report is
The RoCE switch snapshot report is not a separate Oracle utility. It is the Cisco NX-OS snapshot feature, run on the Exadata RoCE switches, combined with a few Exadata-specific sections and a before-and-after comparison. Oracle has no tool by that exact name, which is why the term confuses many DBAs.
An NX-OS snapshot captures the running states of selected features, can be extended with new show commands, and can be compared with or deleted from other snapshots. In practice, the "report" is three outputs:
- The snapshot itself: a named, stored copy of show-command output, kept on the switch.
- The dump: a readable listing of everything one snapshot captured.
- The comparison: a field-by-field diff of two snapshots, as a summary of counts or in full detail.
How a snapshot is structured
A snapshot is a set of sections. Each section is one show command plus the information NX-OS needs to match rows between two snapshots. Cisco's own example section, v4route, captures show ip route detail vrf all, with ROW_prefix as the row id and ipprefix as the key.
| Part of a section | What it does | Exadata example |
|---|---|---|
| Section name | Label shown in dumps and comparisons | lldpnbr |
| Show command | Command whose structured output is stored | show lldp neighbors detail |
| Row id | Tag that marks one row in the XML/JSON output | ROW_nbor_detail |
| Key 1 (and optional key 2) | Field that uniquely identifies each row | Local port id |
Because rows are matched by key, the comparison does not just say "something changed". It names the exact interface, neighbor or route that changed, and shows the old and new values side by side.
Where it fits among Exadata diagnostics
Most Exadata diagnostics describe one moment so Oracle Support can investigate a fault. The snapshot report is different: its value comes from comparison. It answers one question quickly: did the RoCE fabric come back exactly as it was?
04How the report is generated (overview)
You generate the report by logging in to each RoCE switch as admin over SSH, adding the Exadata sections once, then creating, dumping and comparing snapshots. Oracle requires switch commands to be run while connected to the switch management interface as the switch administrator.
Repeat on both leaves and every spine. Row ids and keys can differ between NX-OS releases, so confirm them with show <command> | json before adding a section. Full prerequisites, sample outputs and an automation script are in the step-by-step guide.
05What information the report collects
The report collects operational state in two layers: a built-in summary that every NX-OS snapshot includes, and the Exadata detail sections you add. Together they answer one question: is every server and cell still connected, at full speed, on a clean and lossless path?
Layer 1: built-in feature summary
Every snapshot records the state of the switch's interfaces and of whichever protocols are enabled. The exact list depends on the NX-OS release and the features in the golden configuration, so check it with show snapshots dump <name> after your first snapshot.
| Data point | What it tells you | Healthy result on a RoCE leaf |
|---|---|---|
| Total interfaces | How many interfaces the switch knows about | Same before and after |
| Ethernet ports up / down | How many physical ports have a live link | Up count equals cabled ports |
| VLANs | Number of VLANs defined | Unchanged (Secure Fabric isolation adds more) |
| IPv4 / IPv6 routes | Size of the routing tables | Unchanged |
| Protocol neighbors (if enabled) | Sessions between switches in multi-rack fabrics | All sessions established |
| Spanning tree (if enabled) | Layer 2 loop protection state | Unchanged |
Layer 2: Exadata detail sections
The built-in summary only counts. The Exadata sections identify each port and each host, which is what you need to act.
| Section and command | Information collected per port | What it reveals on Exadata |
|---|---|---|
Interface status: show interface brief | Admin state, operational state, speed, mode, down reason | Every cabled port should be up at 100 Gbps; reasons such as Link not connected or XCVR not inserted explain failures |
LLDP neighbors: show lldp neighbors detail | Neighbor system name, neighbor port (re0/re1), management address | Maps each switch port to a named database server or storage cell |
Transceivers: show interface transceiver | Cable or optic type, vendor, part number, serial number | A changed serial confirms a part swap; a missing entry means the module is not detected |
Error counters: show interface counters errors | FCS, alignment, receive and transmit errors | A jump on one port points to a bad cable, dirty connector or failing optic |
Lossless QoS: show interface priority-flow-control | PFC mode, pause frames sent and received | PFC off or unusual pause counts signal a QoS or congestion problem |
| Routes and inter-switch links (multi-rack) | Route tables, leaf-to-spine neighbor sessions | A lost session or prefix means part of the fabric is unreachable |
Snapshot metadata
Each snapshot also stores its name, creation time and the free-text description you give it. Putting the change ID or Oracle SR number in the description makes the report self-documenting.
What the snapshot does not collect
- Logs and crash history: use
show logging logandshow tech-support details. - The running configuration: back it up separately; a snapshot is state, not configuration.
- Hardware health such as fans, power supplies and temperature: use
show environment. - The server side of the link: use Exadata tools such as
rocelinkinfo,ip linkand Exachk. - Traffic performance over time: snapshots are single points, not trends.
06How to read and use the report
Read the summary comparison first, then open the full comparison only for features whose counts changed. In the detailed output, NX-OS marks values that differ between the two snapshots; no marked lines means the switch returned to exactly the same state.
- Check the summary counts: interfaces up and down, VLANs, routes and neighbor sessions.
- If a count differs, open the full comparison and find the marked lines.
- For each change, note the key (port, neighbor or prefix) and its before and after values.
- Map the port to a host using the LLDP section of the before snapshot.
- Decide whether the change was planned or needs action.
| Difference seen | Likely meaning | Next step |
|---|---|---|
| Port up before, down after | Host still booting, cable unseated or transceiver fault | Wait for the host, reseat the cable, check the port detail |
| LLDP neighbor missing on an up port | LLDP not exchanged yet, or wrong host connected | Recapture after 1 to 2 minutes; check the cabling map |
| LLDP neighbor name changed | Cables swapped between ports | Compare with Oracle's cabling tables and correct |
| Speed dropped (100G to 40G) | Wrong or degraded cable or optic | Replace the cable; verify the part number |
| Transceiver serial changed | A component was replaced | Expected only if you replaced it |
| Error counters jumped on one port | Physical-layer problem | Clean or replace optics and cable |
| PFC off or pause frames spiking | QoS misconfiguration or congestion | Check golden configuration; open an Oracle SR |
| Fewer routes or neighbor sessions | Inter-switch link or spine problem | Check uplinks and the spine snapshots |
A worked example
After a rolling cell patch, the summary on rocea0 shows 30 ports up before and 29 after, while roceb0 is unchanged. The full comparison marks Ethernet1/12 as down. The before snapshot's LLDP section shows that port belonged to celadm03, port re0.
That cell is now running on its roceb0 link alone, a hidden single point of failure. Reseating the cable restores the link, and a fresh after snapshot shows no differences.
07How it compares with other Exadata diagnostic tools
The snapshot report is the only tool in the Exadata kit that compares switch state before and after a change; the others describe one moment or one side of the link. Use it alongside them, not instead of them.
| Tool | Runs on | What it collects | Best used for |
|---|---|---|---|
| RoCE switch snapshot report | RoCE switch (NX-OS) | Port state, LLDP neighbors, optics, errors, PFC; compared over time | Proving the fabric returned to its prior state |
show tech-support details | RoCE switch | Very large dump of switch state, logs and configuration | First thing Oracle Support asks for on a switch fault |
rocelinkinfo (Exadata 24.1+) | Database server | Real-time status of each fabric link, in iblinkinfo format | Viewing the fabric from the Exadata side |
configure_roce_hostinfo.sh (24.1+) | Database server | Labels each switch port with the connected host, IP and port | Making port-level output easier to read |
verify_roce_cables.py | Database server | Checks hosts and switches are correctly cabled | Validating cabling after installation or changes |
| Exachk (AHF) | Database server | Best-practice and health checks, including RoCE switches | Whole-rack health before and after maintenance |
| Sundiag | Database and storage servers | Server hardware, disk and OS diagnostics | Server or storage hardware faults |
| ILOM snapshot | Server ILOM | Service processor, firmware and hardware data | Hardware faults below the OS |
| Oracle ASR (Exadata 21.2+) | Monitoring | Automatic service requests for Cisco switch faults | Hands-off fault reporting |
If patchmgr fails on a RoCE or management switch, Oracle publishes a My Oracle Support note listing the support data to collect for the 9336 and 9348 switches (MOS Doc ID 2871074.1). Attach your snapshot comparison to that data. For server-side diagnostics, see our Exadata Sundiag guide.
08Best practices and security considerations
Snapshot every RoCE switch before you touch any of them, and save every output off the switch. Snapshots live on the switch, so they are lost if the switch is replaced.
- Cover the whole fabric: both leaves in every rack and all spines, never one switch.
- Name consistently:
pre_<activity>_<date>andpost_<activity>_<date>, with the change ID or SR number in the description. - Wait before the after snapshot: let every database server and cell finish booting, or you will chase false "port down" differences.
- Keep a healthy baseline: refresh one per switch monthly so a sudden complaint can be compared against a known-good state.
- Add sections once: define the Exadata sections once per switch and reuse them.
- Clean up: snapshots are never deleted automatically; remove old ones after saving them.
Security and change control
- Read-only by design. Creating, dumping, comparing and deleting snapshots does not change interfaces, traffic or the golden configuration. Only
snapshot section addchanges anything, and it edits the snapshot definition, not the network configuration. - Do not use Cisco maintenance mode (GIR) on Exadata unless an Oracle procedure tells you to; take snapshots manually instead.
- Protect the output. Dumps contain hostnames, management IPs, serial numbers and cabling. Store them like other infrastructure records, and share them only through your Oracle SR.
- Protect switch access. Use the
adminaccount only from trusted database servers, and do not change switch SSH settings outside Oracle's documented procedures.
09Frequently asked questions
Q.Is the RoCE switch snapshot report an Oracle tool?
No. It is the Cisco NX-OS snapshot feature used on Exadata's Cisco Nexus RoCE switches. Oracle's own fabric tools, such as rocelinkinfo and Exachk, run from the database servers.
Q.Does taking a snapshot affect database traffic?
No. It only runs show commands and stores the output, so it is safe on a live production rack.
Q.Is a snapshot the same as a switch configuration backup?
No. A snapshot records operational state (what is up and connected). A backup records configuration (how the switch is set up). You need both before maintenance.
Q.Which Exadata models does it apply to?
RoCE-based systems: X8M, X9M, X10M and X11M. Exadata X8 and earlier use InfiniBand switches, which have different tools.
Q.What is the single most useful section to add?
LLDP neighbors. It turns anonymous port numbers into named database servers and storage cells, so every other difference becomes actionable.
Q.Will Oracle Support accept a snapshot comparison?
It is useful supporting evidence, but Support normally also asks for show tech-support details, patchmgr logs and Exadata-side diagnostics.
10Conclusion
The RoCE switch snapshot report turns "the fabric looks fine" into proof. It records port state, neighbors, optics, error counters and lossless QoS on every switch, and its comparison names exactly what changed. Identical counts, the same LLDP neighbors on the same ports, stable error counters and active PFC mean the Exadata RoCE fabric is fully restored.
Master the Exadata RoCE fabric hands-on
KP Expert's live Oracle Exadata course covers the RoCE network fabric, switch patching with patchmgr, diagnostics like Sundiag and Exachk, and real troubleshooting scenarios.
Explore the Oracle Exadata courseBook a free demo class